
Since collapsing with the housing bubble and the financial crisis, the U.S. economy has staged a dramatic comeback.
However, we are now seeing some signs of slowing again.


See the rest of the story at Business Insider
However, we are now seeing some signs of slowing again.
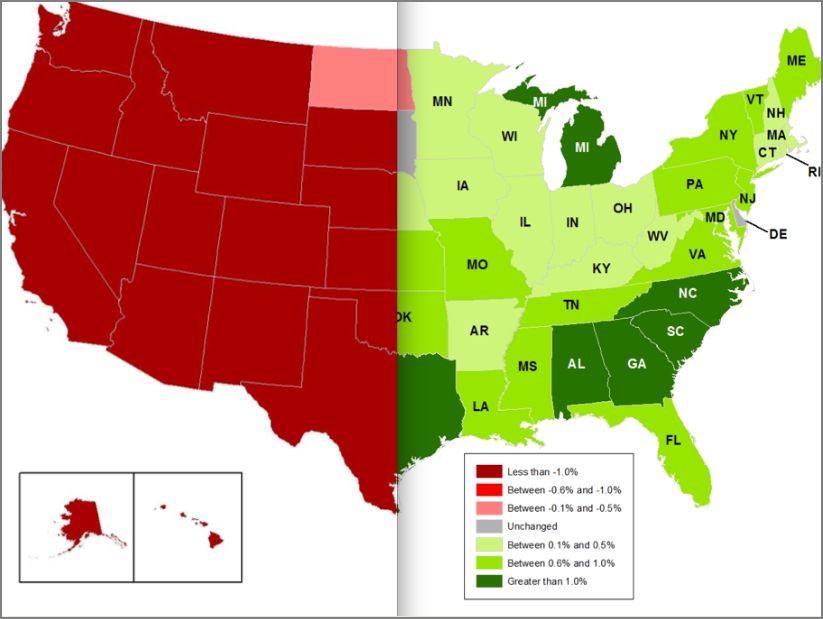
Over the past three months, 45 of the 50 states showed increasing activity, according to the Philly Fed's coincident index of employment, unemployment, manufacturing hours and wages.
Each month, the Philly Fed produces these awesome maps on which red shows economic decline while blue or green show gain.
The maps start in 2005 when the economy was booming.
January 2005
February 2005
March 2005
See the rest of the story at Business Insider
Please follow Business Insider on Twitter and Facebook.